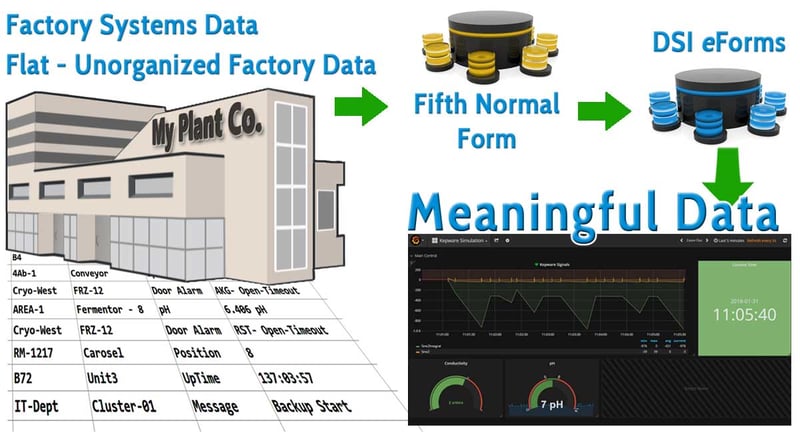
You need organized data, DSI Dashboard Deliver
We’ll analyze where you have your data stored. We can work with your current staff or act on your behalf.
Data will then be stored or rolled up into a convenient Edge database/server.
Have current Operational Data Stores – ODS – that keeps your data in a current state with the metrics you care about.

Fifth Normal Form: Database normalization to reduce redundancy
Using eforms and other tools and services, DSI provides data analysis that helps you get your data into an easy to understand and organized presentation
Create dashboards when the information displayed is going to mean something to the staff viewing them. Augment the capabilities of the team with accurate and concise information!
Grafana– an open source dashboard framework that we will configure for you. This can run on an internal or cloud server!
InfluxDB– An open source historian. We can pump all your time series data into an Edge server with all your critical data.
Dash– Pyre Python Dashboard’s using Plotly’s Dash system.
Cloud – AWS, Azure, DigitalOcean.